Proof over promises
Case studies — five industries, one design principle
Each build is different; the pattern is the same: we translate messy operational reality into a leadership-grade forecasting workspace. Below are representative engagements—illustrative visuals, real consulting rigor.
Book discoveryIndustry
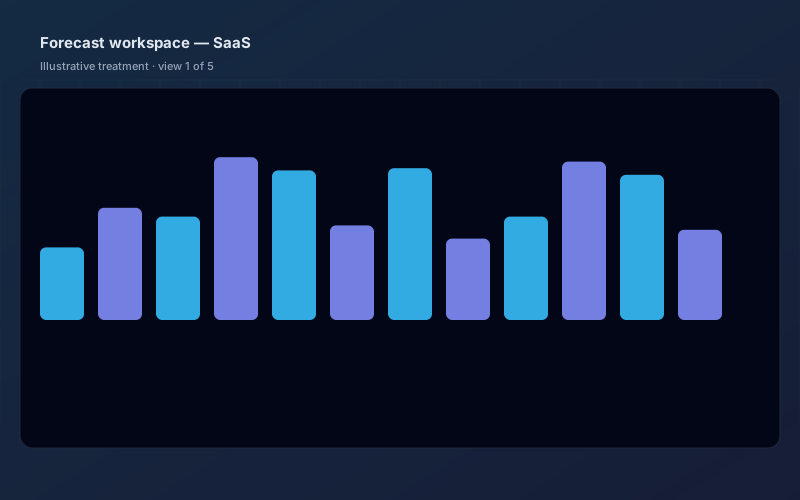
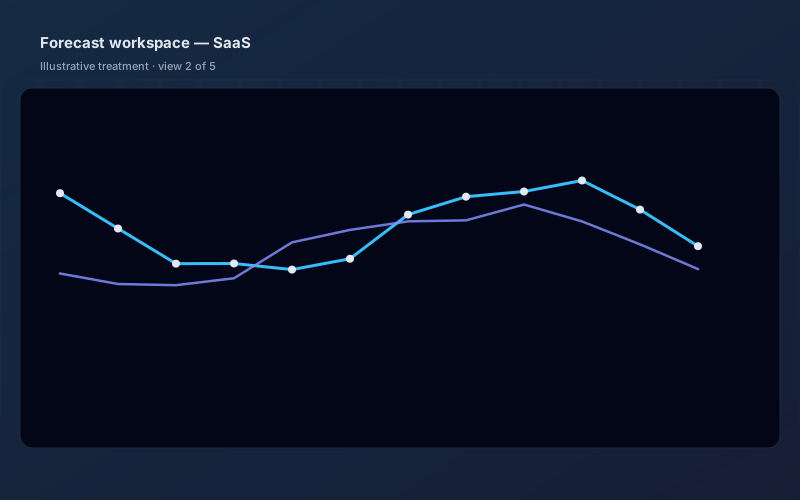
B2B SaaS — multi-tenant MRR in one operating rhythm
Subscription software & platforms · case 1 of 5
A product-led team running hybrid subscription and service revenue needed one forecast that matched billing reality across regions and add-ons—without a shelf BI template.
Challenge
MRR was spread across CRM, finance exports, and product analytics; leadership and customer success were arguing from different “versions of the truth” each QBR.
Approach
We mapped the revenue objects that actually mattered (plans, add-ons, credits) and modelled a cohort-aware MRR view with board-ready baselines, then layered scenario sliders for net retention.
Outcomes we aim for in consultation
- Aligned executive and GTM on a single ARR / NRR story ahead of a Series B data room
- Reduced manual prep for finance from days to a repeatable Friday close rhythm
- Gave CSMs drill-downs tied to subscription events—not vanity usage charts
−42%
QBR prep time (illustrative)
Demo outcome from discovery
11
Sources in cockpit
CRM, billing, warehouse
6+
Forecast iterations / quarter
Scenario what-ifs
Engagement gallery (5 views)
Industry
Healthcare network — margin-aware capacity planning
Hospitals & life sciences · case 2 of 5
A regional care network wanted patient-volume and reimbursement signals linked to block schedules and staffing—without moving PHI into generic public SaaS tools.
Challenge
Forecasting was split between EHR reporting, financial planning models, and operational spreadsheets, which broke whenever payor mix or seasonal flu loads shifted.
Approach
We designed a role-based forecasting workspace with de-identified aggregates, guardrails for least-privilege data paths, and finance-grade variance views against budget.
Outcomes we aim for in consultation
- Unified clinical ops and finance with a shared 13-week view of load vs. target
- Surfaced under/over-capacity service lines for targeted scheduling actions
- Gave the board a explainable bridge from volume to margin—not a black box
Weekly
Variance review cycle
Surgical vs. med-surg
28
KPIs tracked
Census, RVU mix, DSO
3
Data zones
Analytical vs. clinical
Engagement gallery (5 views)
Industry
Omnichannel retail — inventory, promo, and cash in sync
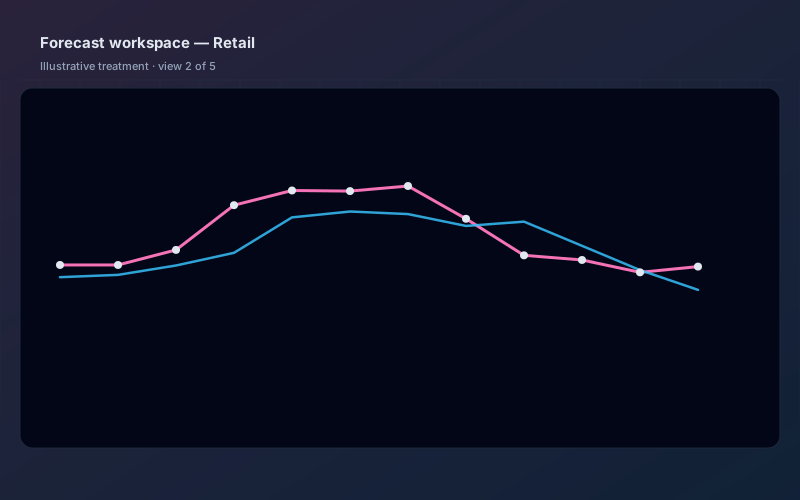
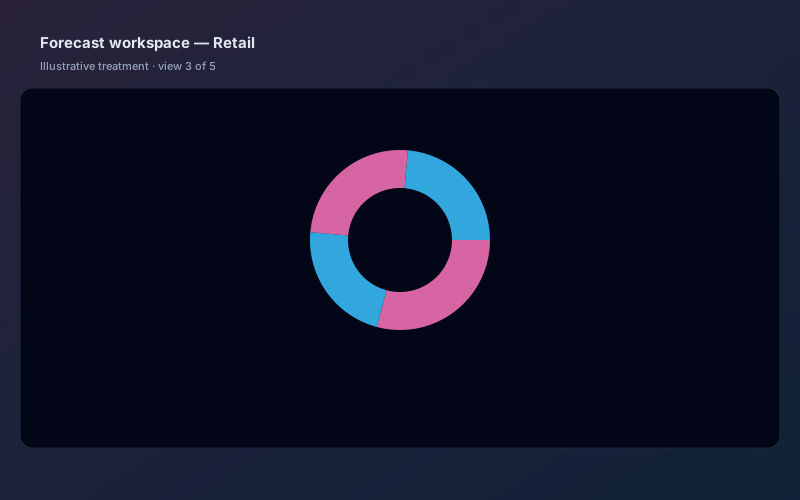
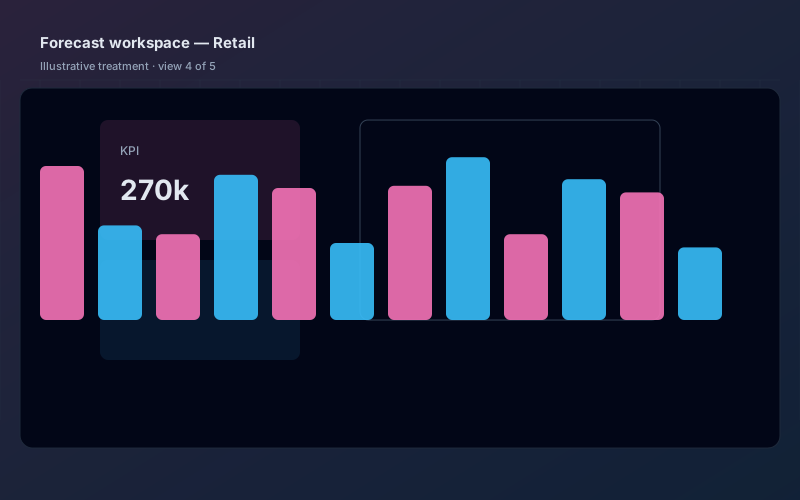
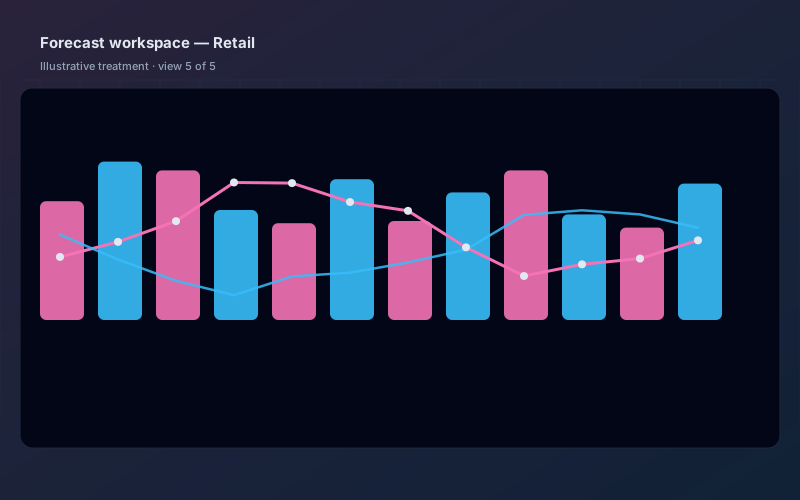
Retail & e-commerce · case 3 of 5
A multi-channel brand needed a demand and cash view that connected POS, 3PL, and marketplace events so merchandising and finance could stress-test the next campaign.
Challenge
Peak-season surprises came from lags between sell-through, inventory, and ad spend, making “safe” promotions expensive and slow to plan.
Approach
We built a margin-forward dashboard: weekly demand bands, pack-level inventory, and a rolling cash view so trade spend could be rehearsed with guardrails.
Outcomes we aim for in consultation
- Brought store, online, and wholesale levers into a single “promo rehearsal” view
- Gave the CFO a rolling 8-week working-capital forecast tied to receipts
- Enabled ops to pre-stage buy decisions around demand bands—not gut feel
5
Channels combined
POS, DTC, wholesale, 3P
SKU-level
Assortment health
A/B carry decisions
12+
What-if promos / season
Scenario runs
Engagement gallery (5 views)
Industry
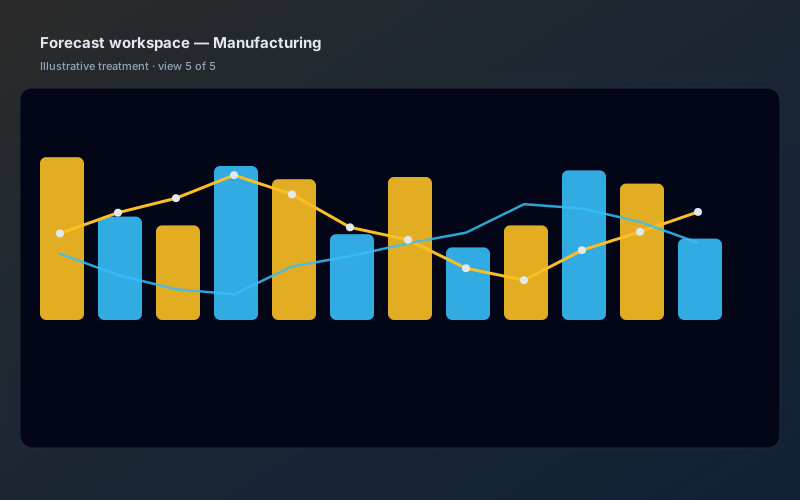
Manufacturing — throughput, lead time, and supplier risk
Advanced manufacturing & logistics · case 4 of 5
A make-to-order manufacturer with volatile raw inputs needed a forecast that tied order backlog, supplier slippage, and plant constraints—without a seven-tab spreadsheet ritual.
Challenge
Production and procurement met daily with static snapshots; the CEO still asked “are we on track for the quarter” without a defensible number.
Approach
We consolidated ERP, MES, and forward orders into a finite-capacity view with slippage alerts and a supplier stability scorecard derived from on-time and price variance history.
Outcomes we aim for in consultation
- Gave a single on-hand / on-order / at-risk story for the weekly ops meeting
- Replaced ad-hoc expedite triage with ranked delay drivers
- Tied working-capital conversations to the same dashboard leadership trusted
140+
BOM lines & vendors
Rolled up
Daily
Constraint alerts
Bottlenecks
4
Supplier tiers
Stability + spend
Engagement gallery (5 views)
Industry
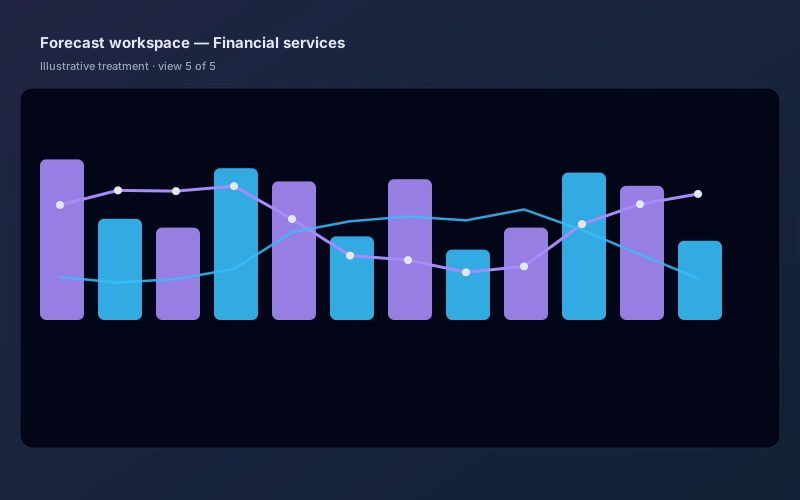
Professional & financial services — project margin under pressure
Financial & professional services · case 5 of 5
A services firm with blended fixed-fee, T&M, and retainer work needed a forward view of margin that respected utilization, pipeline quality, and hiring timing.
Challenge
Revenue looked fine on paper until write-offs and bench cost arrived too late; partners wanted “what if we move two seniors” without another FP&A cycle.
Approach
We unified CRM pipeline confidence with resourcing and cost rates in a project-centric forecast, with client-level bridges from sold backlog to expected margin.
Outcomes we aim for in consultation
- Brought resourcing, delivery, and finance to one margin narrative each month
- Surfaced at-risk projects early via margin erosion triggers vs. plan
- Helped the exec team model hiring and rate moves with a shared model
4
Service lines
Mapped cost curves
Margin $
Rolling 6-mo view
Fee + utilisation
8+
Scenarios on deck
Staffing, rates
Engagement gallery (5 views)